
Lancaster University used an innovative approach to better understand the student journey by updating the process of mapping it. In part one of a two-part blog series, the project’s head, Claire Povah, explains what her team did.
The overall aim of the project was to easily visualise and understand the complexity of the journey. Through the project we wanted to identify those touch points on the student journey which were challenging and use this visual data to influence change.
We engaged students and staff – in both academic and professional services – and asked them to create a visual representation of the student journey. Creativity was the key and we took a Blue Peter approach to the initial mapping exercise: there were lots of pens, paper, post-its and magazines. Collages were designed, complex maps and the artistic talents of students and staff were put to great use.
Road-testing the map
Now, here’s where we also took a different approach to mapping the journey, we gave the data collected to an independent ‘visualiser’, someone who would not look at the data through the lens of how our university operates, but take a purely objective view.
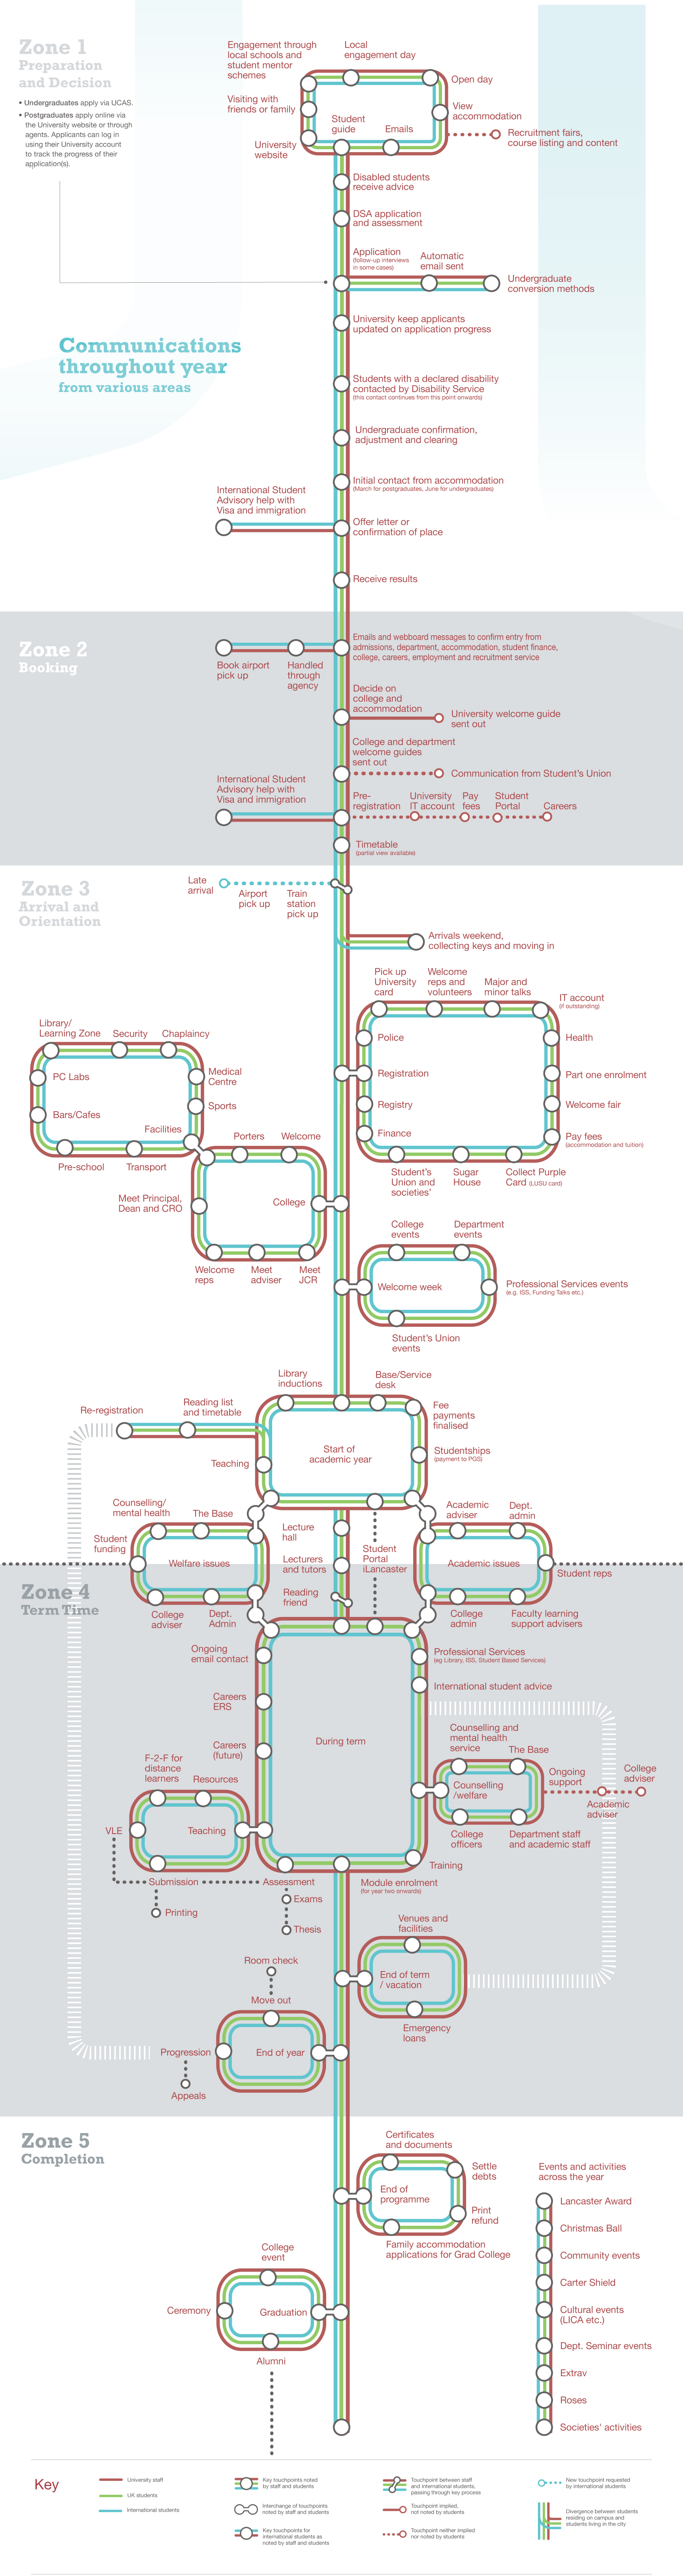
The resulting ‘tube map’ represents the student journey across five zones, from preparation and decision all the way through to completion and beyond, though I have to say there is no ‘Mornington Crescent’ on this tube map.
With the map created, the next stage was to test and verify it with our students. Pop-up banners with the map emblazoned across them were set up at registration and incoming students were asked about their journeys and whether the map reflected these. This helped us to identify the key challenges faced by our students on arrival.
Lancaster University is campus-based, so can you guess what the number one challenge for our new students was? Yes, you guessed it: finding their way around campus. Our campus maps stumped our new arrivals.
Aim is to “understand variations in the journey”
The challenges identified were shared across professional services and colleagues rose to the challenge. Our facilities team improved the campus maps and is now working on a wayfinder project. Colleagues across our IT services took the journey map and looked at how they could support students throughout the journey. We’ve also created applets and interactive checklists to enhance the journey to Lancaster for new students.
So what’s next for the student journey project at Lancaster? We will continue to use the map to gather student feedback on the arrivals process, with continuous improvement sitting at the heart of this process. The map as it stands represents the ‘average’ truth. Our aim now is to identify and understand variations in the journey and make improvements where necessary. The aim being to understand the nature of these variations and improve them where necessary.
As our customer service excellence assessor noted during the recent annual surveillance visit, the journey mapping project and our innovative and original approach to the project, has enabled us to develop our customer understanding and enhance the student experience. Remember, as Einstein noted, “if you always do what you always did, you will always get what you always got”. Well, that certainly won’t be the case here at Lancaster University thanks to the student journey map.
Claire Povah is the head of strategic development in Student Based Services at Lancaster University.


